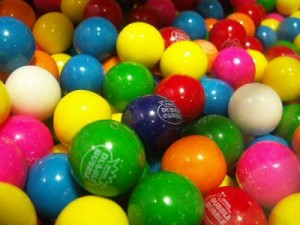
 The Juniors have been studying scatter plots and lines of best fit. They have generated their own data for a scatter plot using a gumball rolling down an inclined plane. They recorded and graphed the height that the gumball was released and the distance the gumball traveled. They used their calculators to determine the line of best fit and then compared values read from the graph to values obtained in class.
Mrs. Wong
No Comments
No comments yet.
RSS feed for comments on this post.
Sorry, the comment form is closed at this time.